MetaBó-BainneMilk Metabolite Database

Studies / Diet study

Pasture proportion in the diet

How the share of grazed pasture in the cow's diet and the season of the year shape the milk metabolome.

Rojas-Gómez P, Pariyani R, Bateman LM, Lynch D, Timlin M, Dineen M, McCarthy NA, et al. Effect of proportion of pasture in the cow diet and seasonality on the milk metabolome as determined by 1H-NMR. Journal of Dairy Science 108(5): 4659–4673 (2025). DOI: 10.3168/jds.2024-26168 Read the paper ↗

34of 43 metabolites changed by diet (p < 0.05)
31of 43 metabolites changed by season (p < 0.05)
15of 43 metabolites changed by diet × season (p < 0.05)

The three feeding systems

GRS Perennial ryegrass pasture

Cows graze primarily on pasture, relying on fresh grass as the main nutrient source. In this study the GRS diet was grazed perennial ryegrass (Lolium perenne L.) through rotational grazing, about 95% of the annual diet, plus parlour concentrates (5%). The system is low-cost, environmentally sustainable and supports natural cow behaviour.
PMR Partial mixed ration

Combines grazing and a mixed ration. Cows grazed perennial ryegrass outside during daylight hours and were housed at night on the TMR diet at half the quantity. The PMR diet was 45% grazed grass (9 kg), 22% concentrates (4.5 kg), 22% maize silage (4.5 kg) and 11% grass silage (2.25 kg).

TMR Total mixed ration

A fully controlled feeding strategy in which all components (silage, hay, grains, protein sources, vitamins and minerals) are mixed into a single ration. The TMR concentrates had 93.9% DM, with 22% CP, 23.9% NDF and 7.2% ash. The parlour concentrates fed to each herd (the sole concentrates for the GRS herd) had 89% DM, 13.3% CP and 30.9% fibre.

Study design

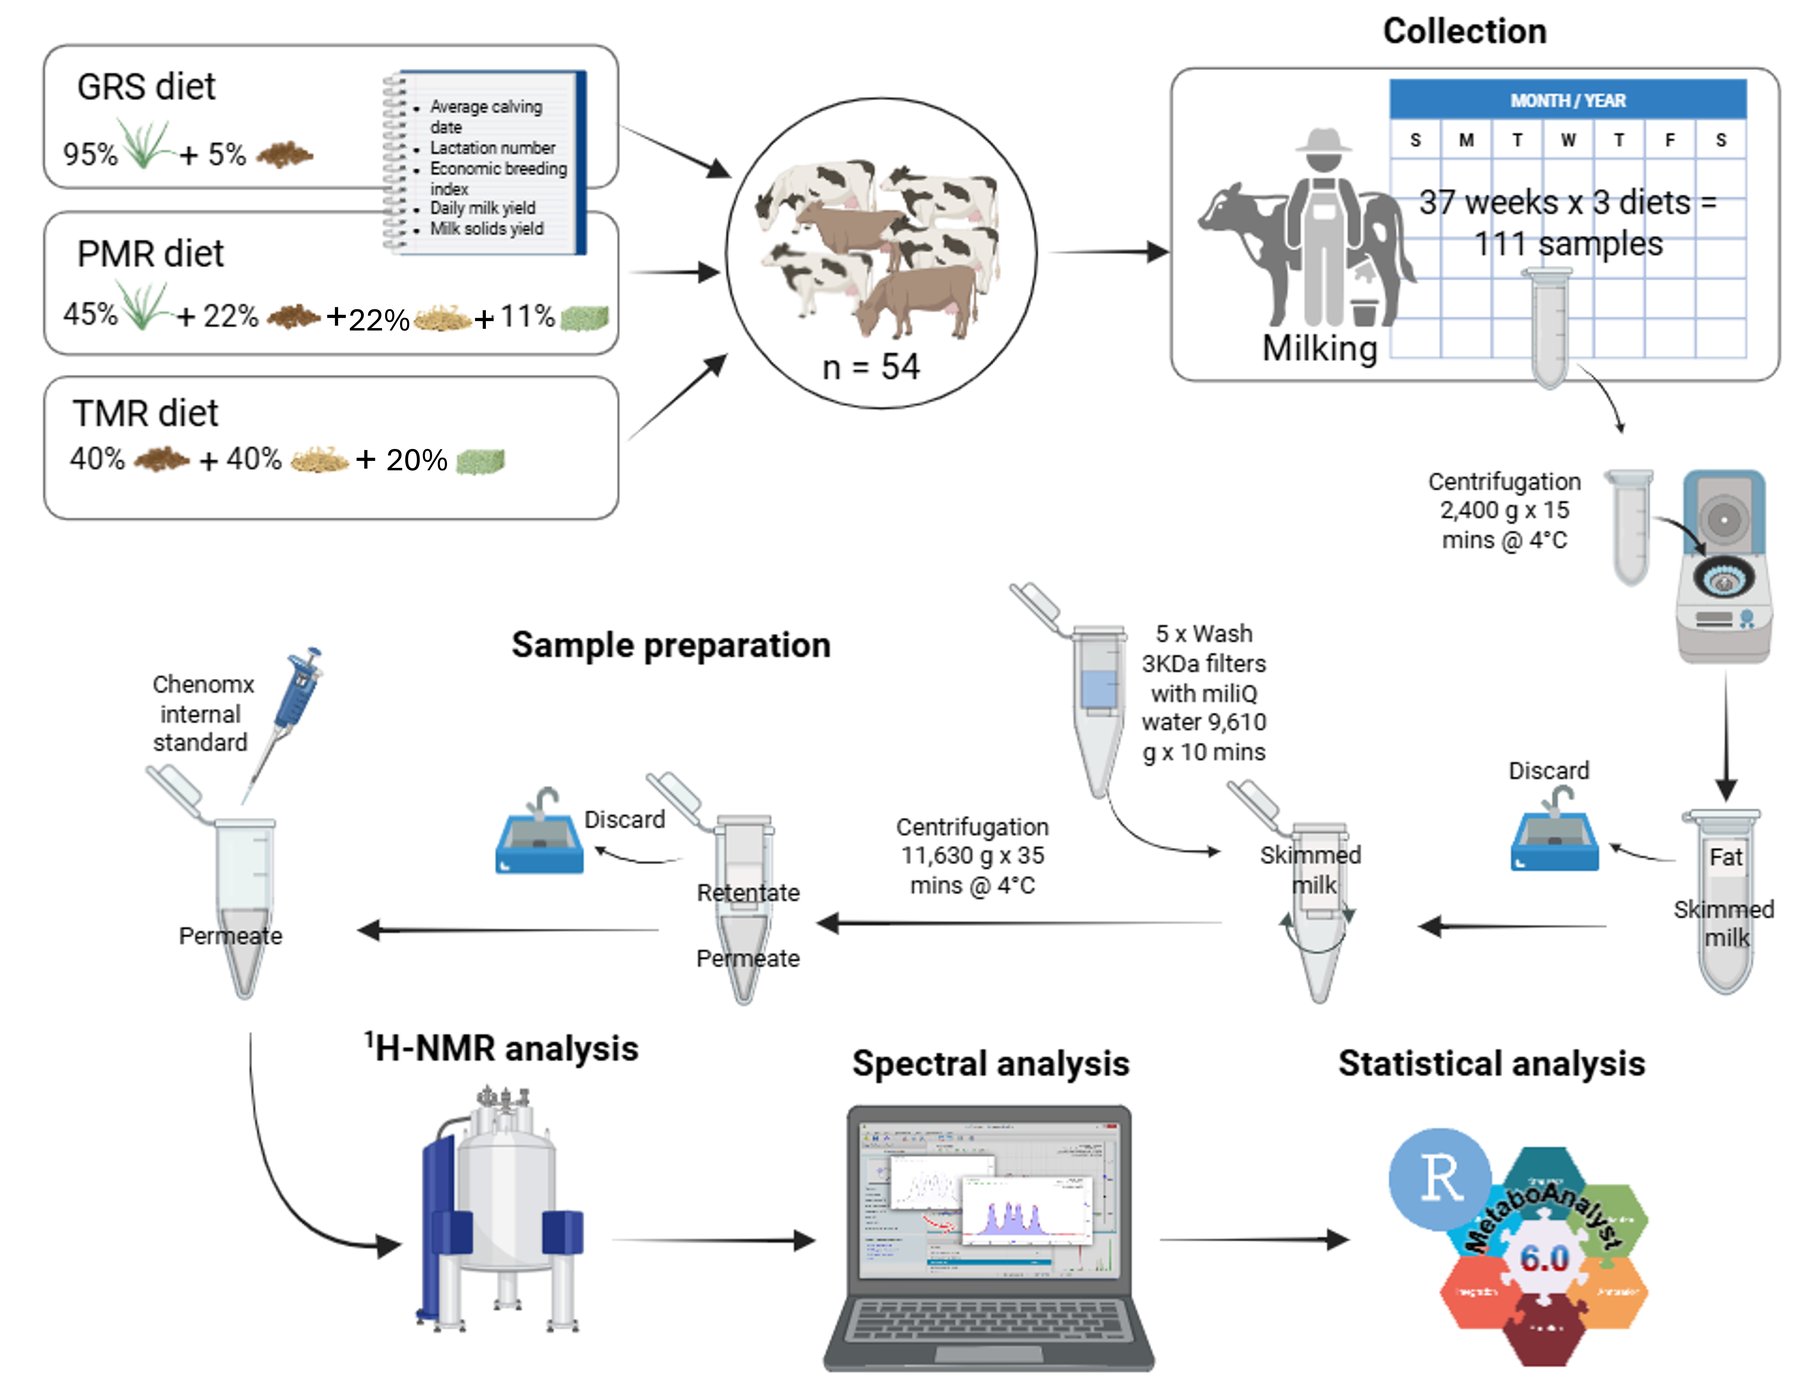
54 cows were assigned to three feeding systems (GRS, PMR and TMR) and their milk was sampled over 37 weeks (37 weeks × 3 diets = 111 samples). Skimmed milk was filtered through 3 kDa filters and analysed by ¹H-NMR, with spectral analysis and statistics in R and MetaboAnalyst 6.0.

Experimental outline of the diet study
Experimental outline: three feeding systems, milk collection over 37 weeks, sample preparation (centrifugation, 3 kDa filtration, Chenomx internal standard), ¹H-NMR, spectral analysis and statistical analysis.

Key findings

  • The proportion of pasture in the cow diet had a significant effect on the milk metabolome.
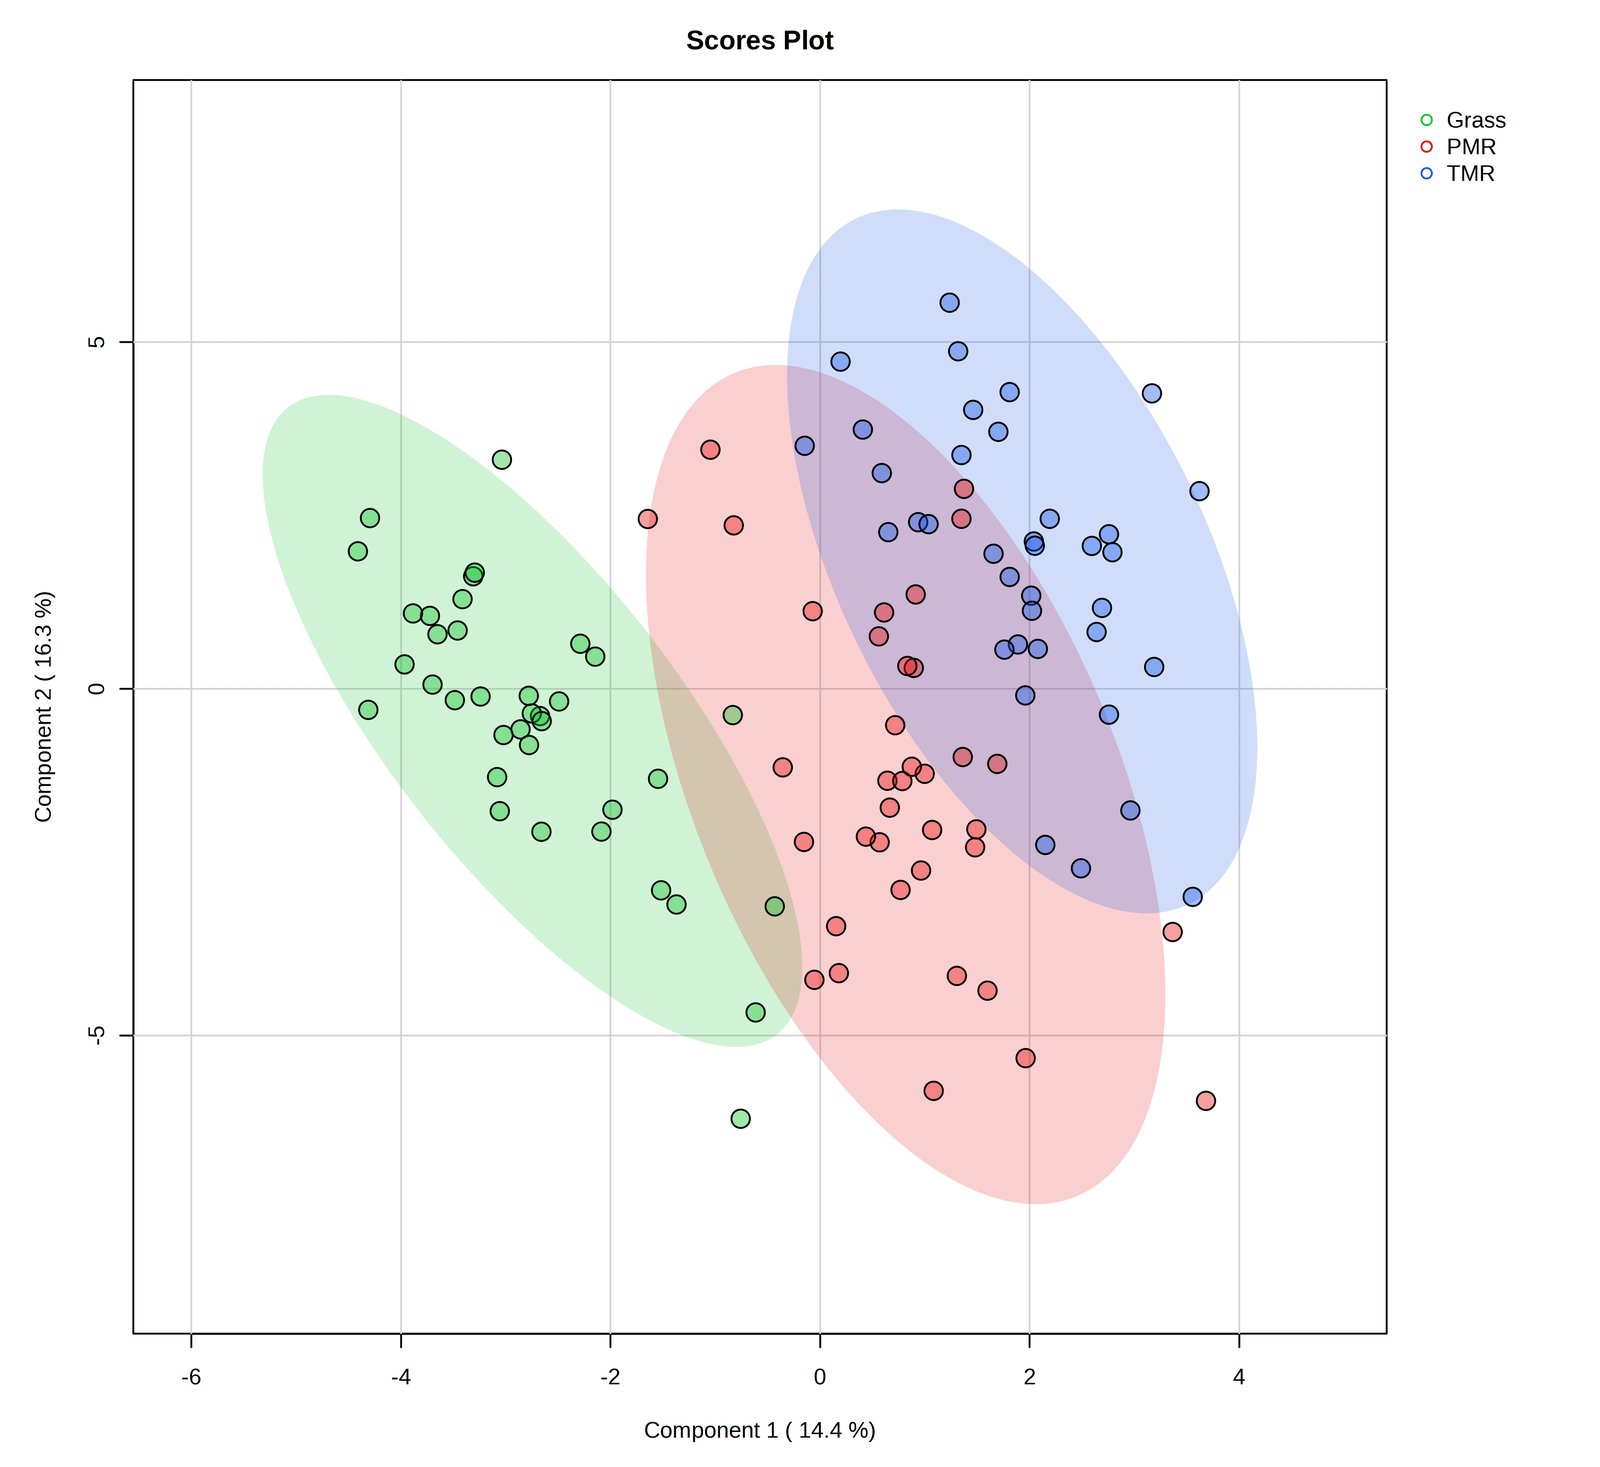
  • Multivariate analysis (PLS-DA) separated the diets, with sample relationships changing in line with the proportion of pasture: GRS milks segregated clearly from TMR milks, while PMR milks resembled both.
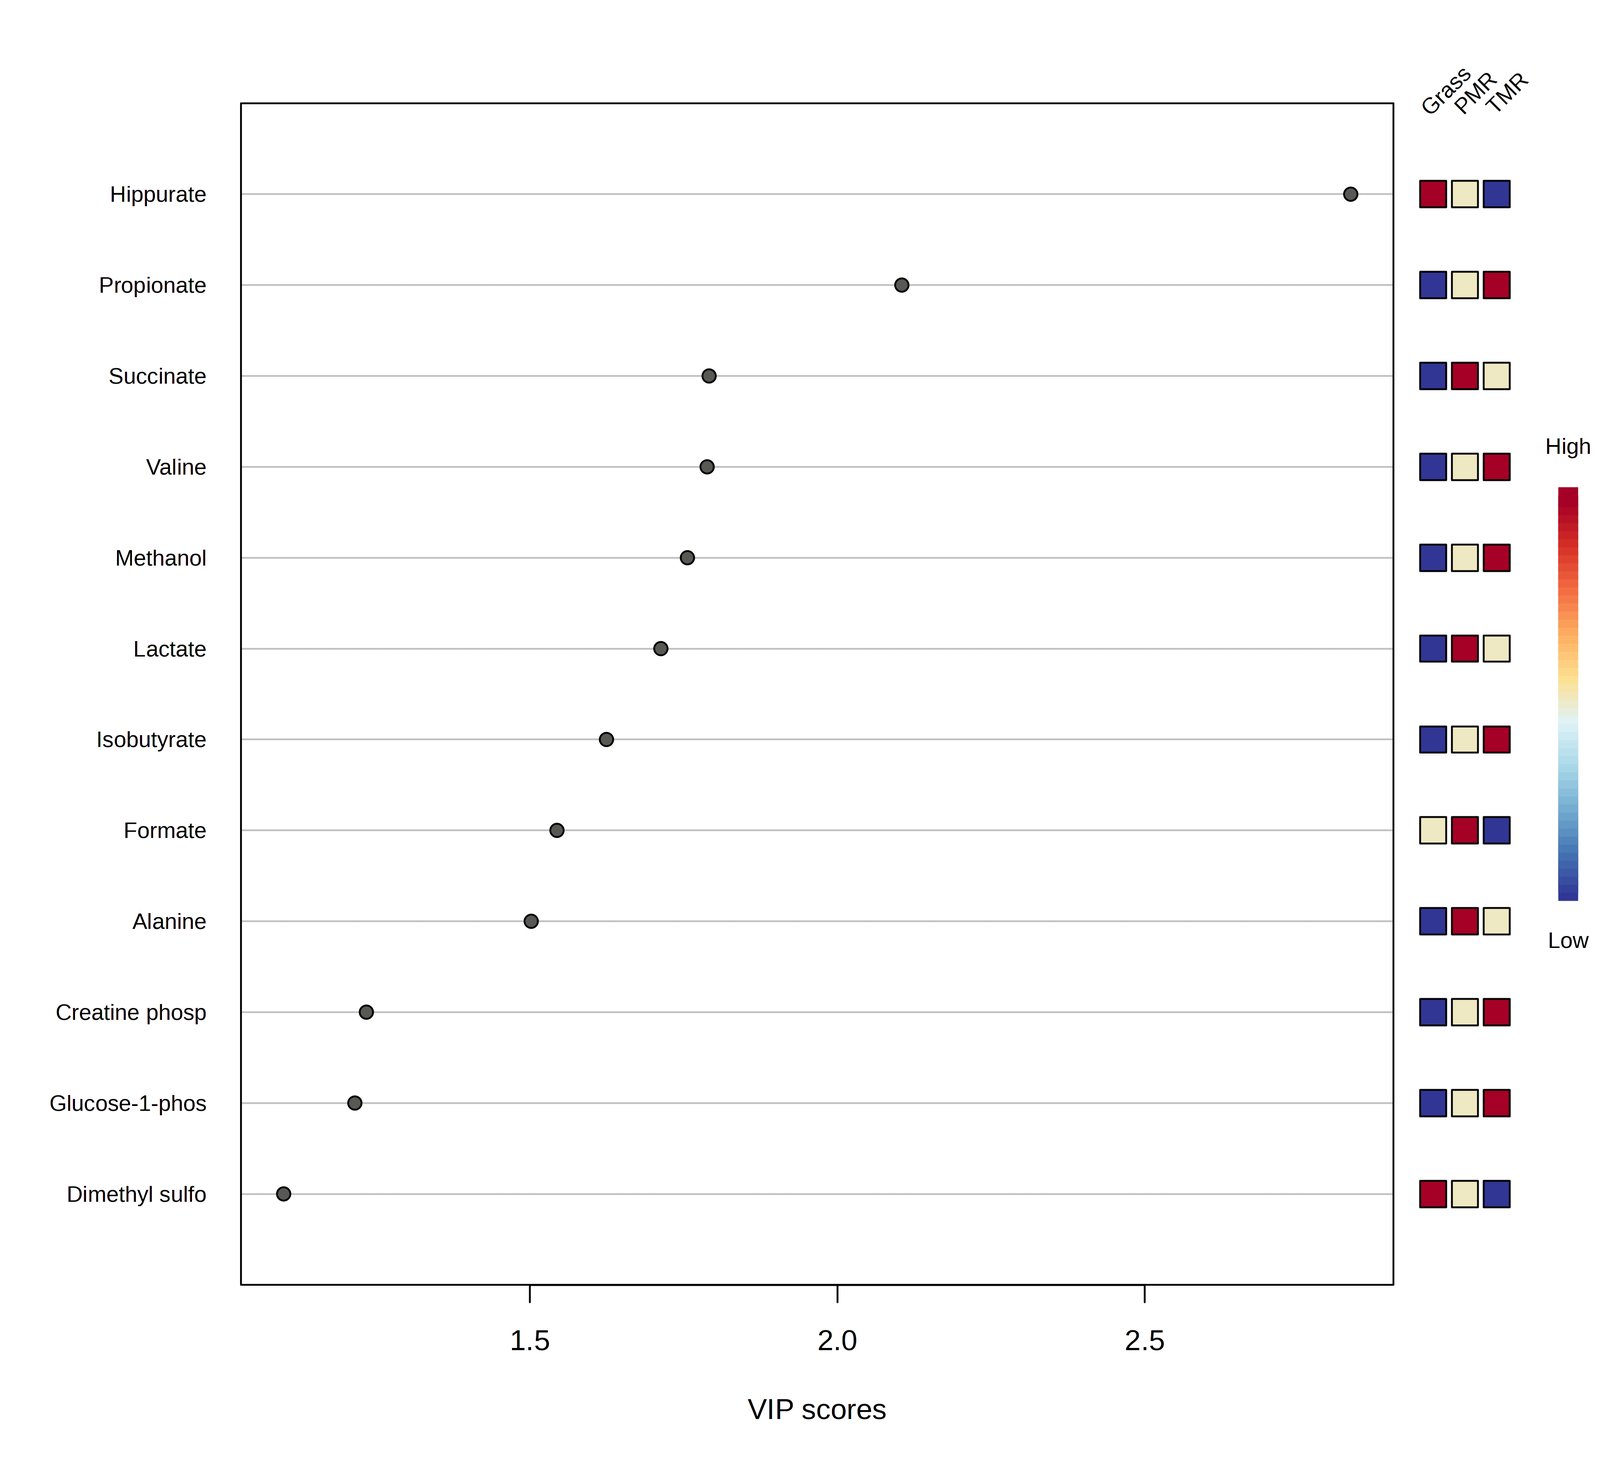
  • Variable importance in projection (VIP) analysis highlighted 12 metabolites driving this separation: hippurate, propionate, succinate, valine, methanol, lactate, isobutyrate, formate, alanine, creatine phosphate, glucose-1-phosphate and dimethyl sulfone.
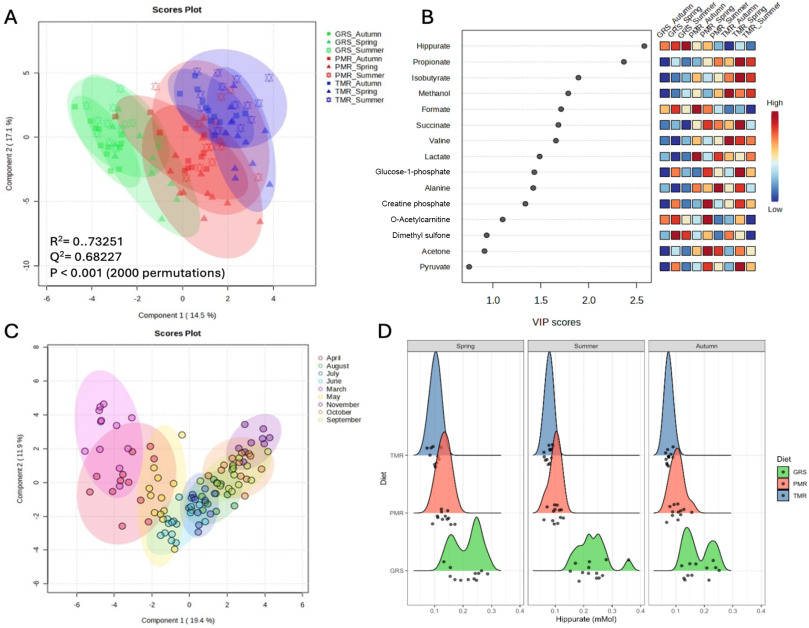
  • Hippurate was the most distinctive marker of diet, rising in proportion to the amount of pasture (AUC = 1.0 for GRS vs TMR).

Published figures

From the multivariate analysis of individual milk samples. Click a figure to enlarge it.

PLS-DA by feeding system
PLS-DA by feeding system. PLS-DA scores plot of milk metabolite profiles from Grass (GRS), PMR and TMR diets. Component 1 explains 14.4% and component 2 16.3% of the variation; shaded ellipses mark each group.
Key metabolites (VIP)
Key metabolites (VIP). Variable importance in projection (VIP) scores for the 12 metabolites that best separated the feeding systems. The boxes on the right show relative concentration in Grass, PMR and TMR milk (red high, blue low).
Diet × season
Diet × season. (A) PLS-DA by diet and season (R² = 0.73, Q² = 0.68, P < 0.001 from 2,000 permutations). (B) VIP scores with relative concentrations for each diet × season group. (C) PLS-DA by month of lactation. (D) Hippurate distribution by diet in spring, summer and autumn.

One metabolite, every diet and season

Mean ± SD in mM. Press tour to step through every metabolite with a significant diet × season interaction.

    Dietary shift across seasons

    How far one diet moves each metabolite relative to another, one dot per season. A long line means the diet effect depends on the season. Sort by a season to watch the ranking reshuffle.

    Sort by

      Significance table

      P-values as reported. Bold values are below 0.05. Sort by any column; metabolite names open their MetaBó-Card.